

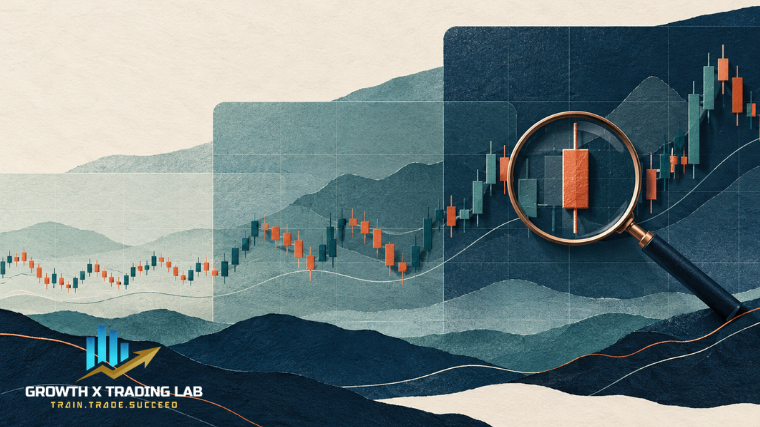
A forex chart shows how the exchange rate of a currency pair changes over time. To read one carefully, first identify the pair and timeframe, then understand what each candle represents. Only after that should you interpret the price pattern.
A chart can help organize observations; it cannot predict a future price move with certainty.
Start with the currency pair A pair such as EUR/USD compares the euro with the U.S. dollar. The first currency is the base currency and the second is the quote currency. The chart’s price scale shows how much of the quote currency corresponds to one unit of the base currency.
If EUR/USD rises, that means the quoted value of one euro has risen against the dollar during the period shown. It does not mean that the euro is strengthening against every currency.
Choose a timeframe before reading the pattern A chart timeframe determines how much time is represented by each candle. On a one-hour chart, each candle represents one hour of price information. On a daily chart, each candle represents one day.
Changing the timeframe changes how price movements are grouped. A short-term fluctuation may appear prominent on a very short chart but much smaller on a longer chart. Beginners should record the timeframe they use so that observations remain consistent.
Understand what a candlestick shows A candlestick summarizes four prices for its period:
Open: the price at the start of the period High: the highest price reached Low: the lowest price reached Close: the price at the end of the period The candle’s body shows the distance between its open and close. Its upper and lower wicks show the extremes reached during that period. A candle still forming can change before the timeframe ends, so its current shape is not final.
Read price in context A single candle rarely explains the broader chart. Look at a sequence of completed candles and note whether price has been moving within a range or forming a series of higher or lower swing points. Mark areas where price previously paused or reversed, but treat them as zones for observation rather than exact boundaries.
A useful reading routine is:
Identify the pair and timeframe. Check whether the latest candle is complete. Describe the recent movement without predicting what must happen next. Mark relevant prior price areas. Write down what would change your interpretation. This process encourages clear observation. It does not turn chart patterns into reliable forecasts.
Common mistakes when reading forex charts Beginners may switch timeframes until a preferred pattern appears, treat every candle as a signal, or interpret a chart only after seeing what happened next. Keeping notes before an outcome is known can help separate an observation from hindsight.
For a broader introduction, read GrowthX’s forex trading foundation guide. To review the available learning programs, visit GrowthX's best forex trading courses.
Frequently asked questions What is the easiest forex chart to read? A line chart is visually simple because it connects prices over time. Candlestick charts show more information for each period, including the open, high, low, and close.
What do forex candlesticks show? Each completed candlestick summarizes the open, high, low, and close for its timeframe.
Can a forex chart predict the market? No chart guarantees a future move. It presents historical and current price information that traders may interpret in different ways.
Risk disclosure: This article is for educational purposes only. Trading involves risk and may result in loss of capital.